😮 OMG (Oh My Gamma!!!) - SPX-ES GEX Snapshot updated daily
FREE GEX profile freshly daily updated.
This tool provides the Gamma Exposure Profile based on SPX Option Chain. All strikes shifted on ES future front contract for ES/MES future traders.
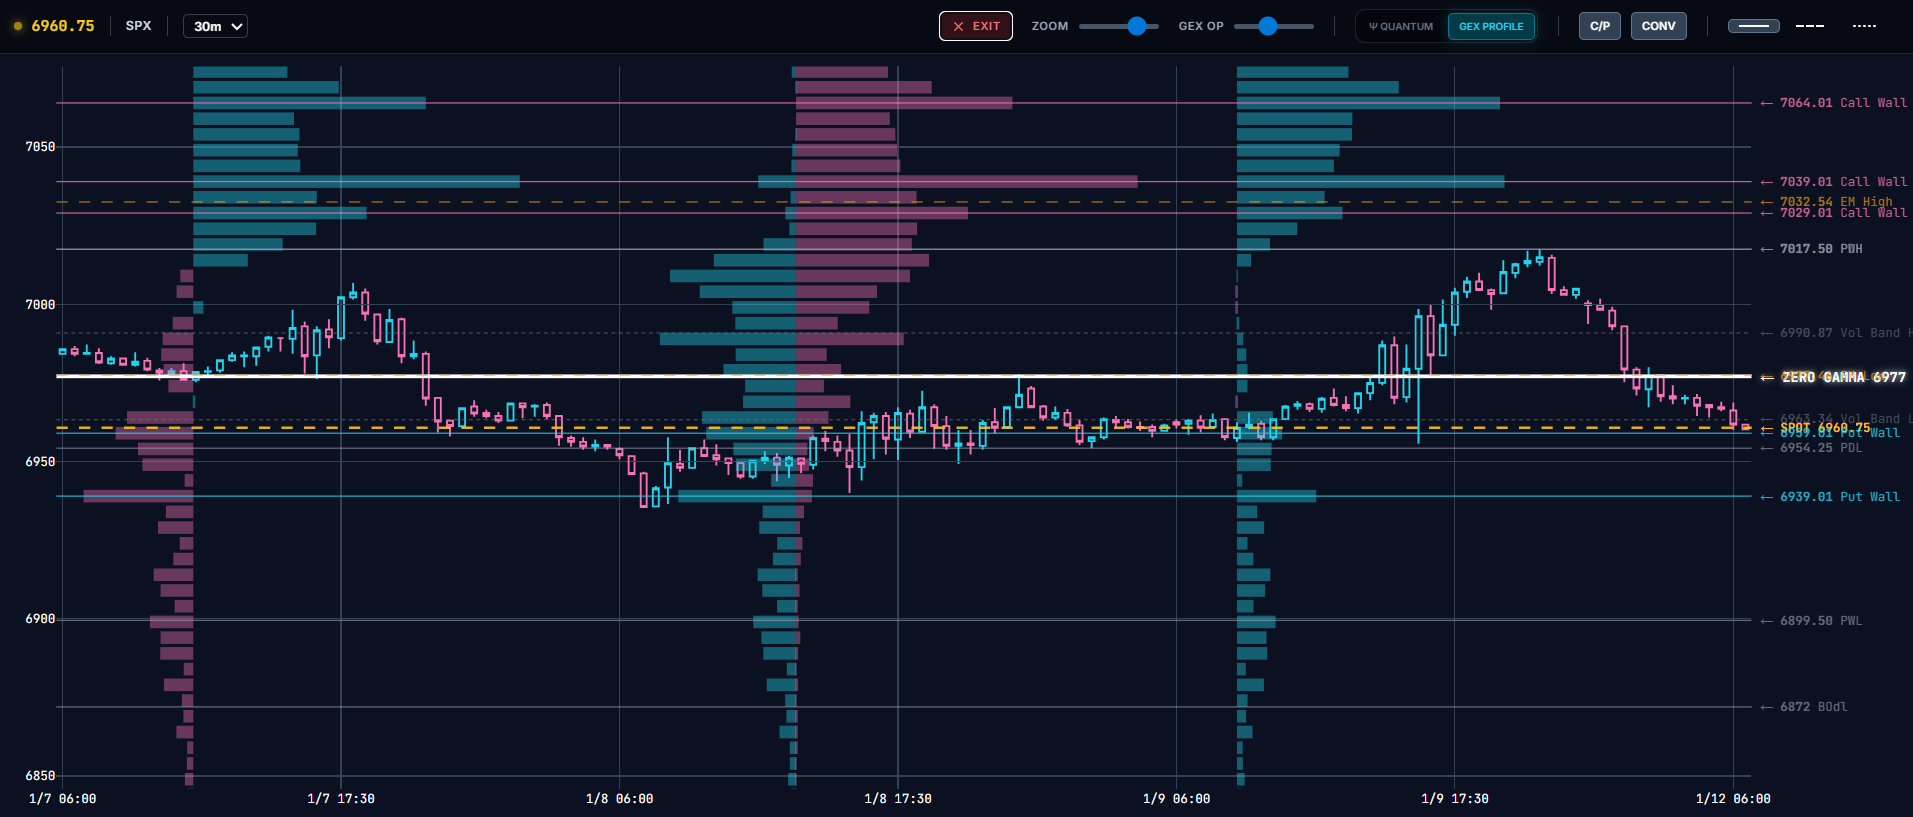

Trade Like a Dealer
Release 3.5 · Live
Institutional-grade market structure and dealer flow analytics, wrapped in a calm and pleasant interface designed for clarity and focus.
Context, not calls. Structure, not signals.
Start Building a Real Edge.
Loading latest interactive GEX data...
Loading GEX Data...
How to Read the Chart: 3 Levels of Analysis
This chart shows the dealers' positioning 'map'. Here’s how to read it in 3 simple steps.
1. Total Gamma Analysis (Regime)
The Zero Gamma level (white line) is the pivot that divides the market into two regimes. The price's position relative to this level influences dealer behavior and, consequently, volatility.
🔴 Negative Regime (Below Zero Gamma): Instability
What Happens: The market tends to be more volatile and trend-following. Sharp moves are more likely.
Why: Dealers are forced to buy into rallies and sell into dips, "adding fuel to the fire" and accelerating price movements.
🟢 Positive Regime (Above Zero Gamma): Stability
What Happens: The market tends to be more stable and mean-reverting. Volatility tends to decrease.
Why: Dealers sell into rallies and buy into dips to keep their positions neutral, acting as a "brake" on price movements.
2. Call & Put Gamma Analysis (Imbalance)
If Call Gamma (Green) dominates:
The market has a bullish bias. Large green bars act as a "ceiling" (resistance), slowing down rallies.
If Put Gamma (Red) dominates:
The market has a bearish bias. Large red bars act as a "floor" (support), slowing down drops.
If they are balanced:
The market is in equilibrium. The price tends to get "trapped" between the two main walls (sideways or range-bound market).
3. Structural Concentration (Points of Interest)
Implication: Areas of high gamma concentration indicate strong dealer positioning. These levels become magnets: price is often drawn to these zones and tends to react strongly upon reaching them.
GEX Explained
The basics, in order, from the beginning: what the option market is, what gamma exposure actually measures, and why price behaves the way it does around a strike that carries a lot of it. No prior knowledge assumed, and nothing to buy.
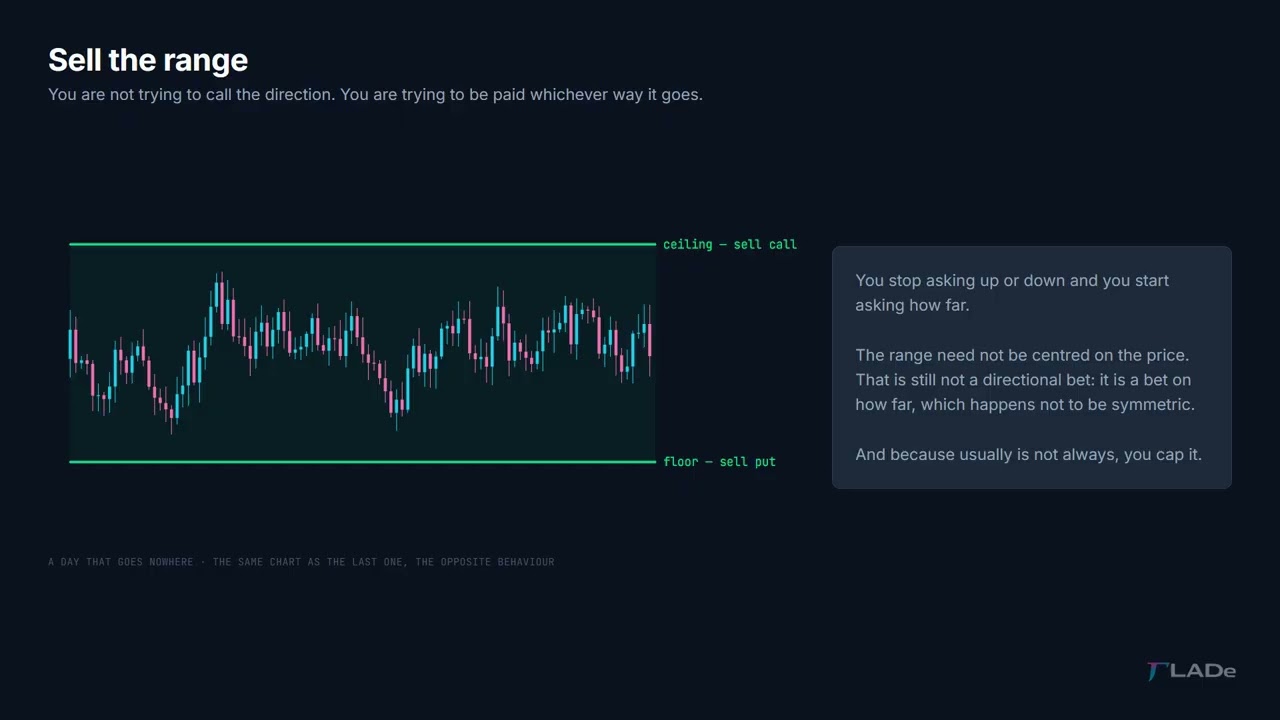
Chapter 01
The Option Market
Who buys options, who sells them, and what each side is actually trying to do. Nothing about gamma yet — the players first.
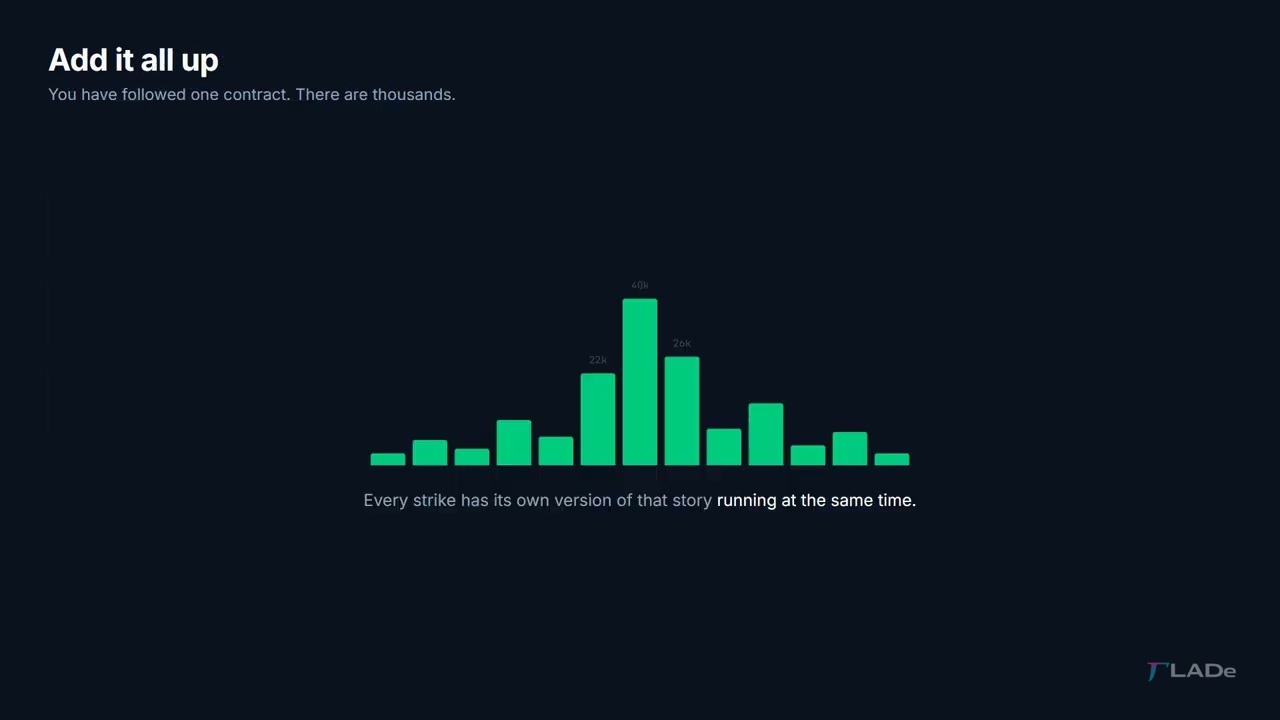
Chapter 02
What GEX Is
The flow nobody chose. Why a dealer who wants no opinion on direction still has to buy and sell, all day, because of what they are holding.
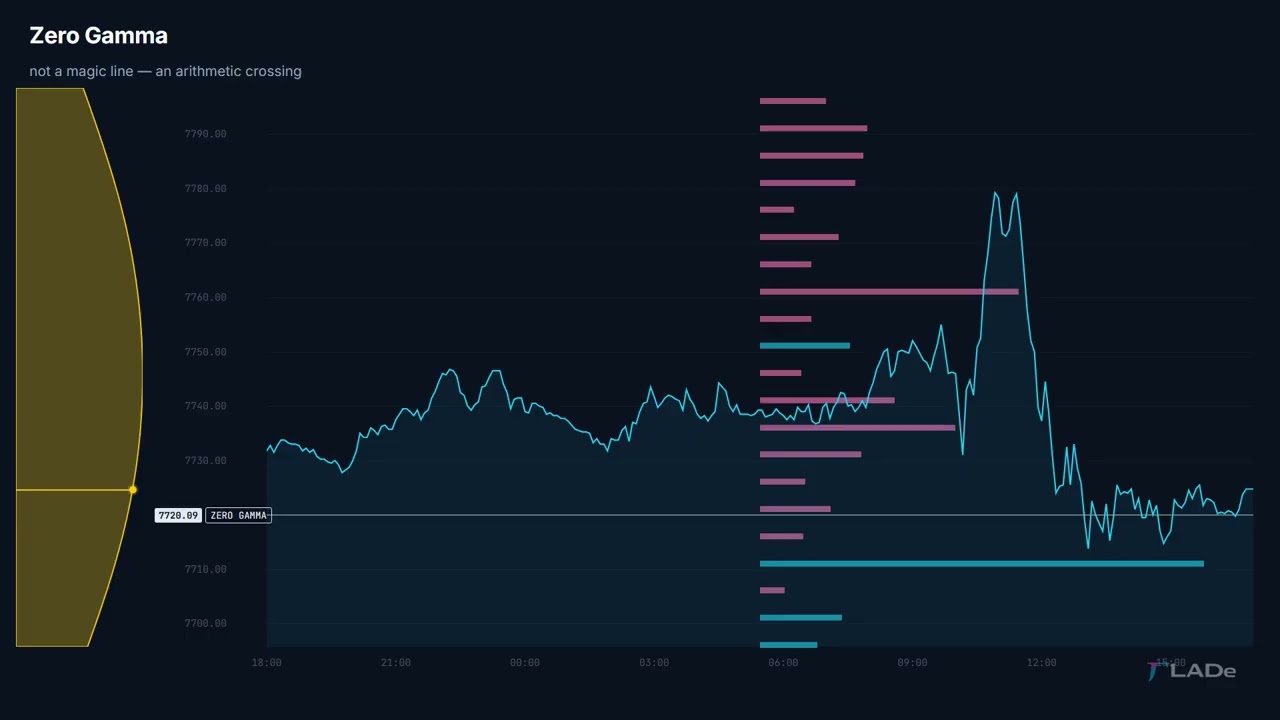
Chapter 03
Delta, Gamma, and a Big Strike
What changes when a lot of open interest sits on one strike, and why price behaves differently near it than anywhere else.
More chapters are being made.

Trading Deserves a
Beautiful Terminal.
0DTE S&P 500 / NASDAQ 100 — Institutional-grade Gamma Exposure analytics for ES, NQ, SPX, NDX — wrapped in a calm interface designed for clarity and focus.
Beyond GEX.
Market Structure as you’ve never seen before.
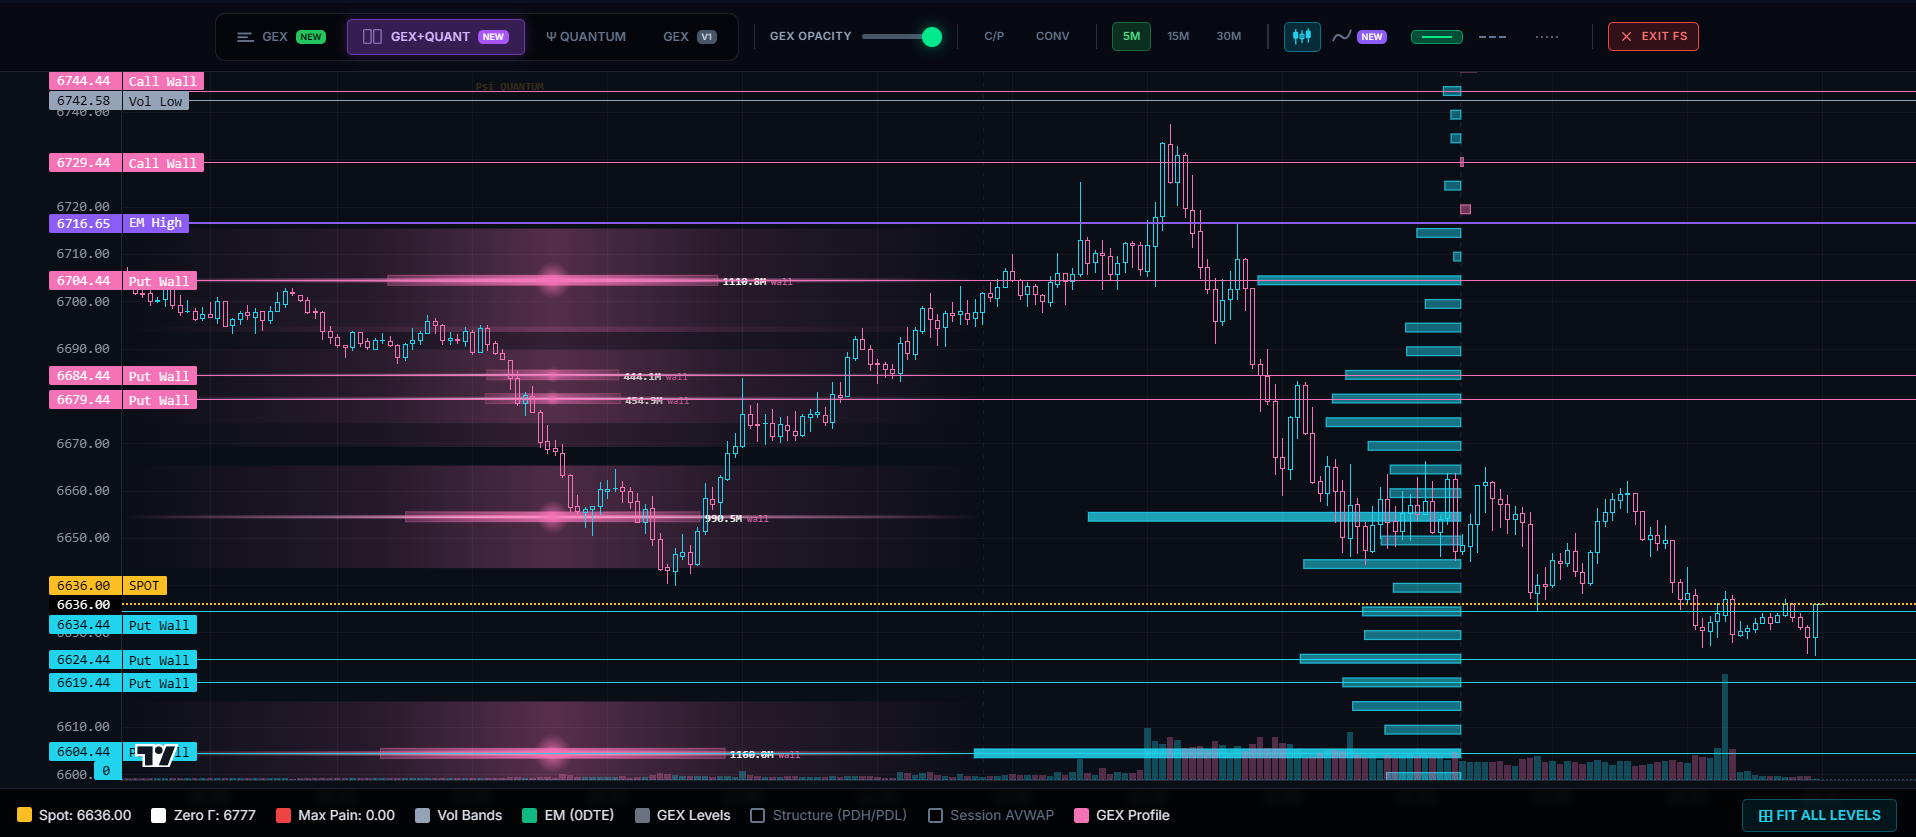
TLADe’s Quantum Engine shows you the gravitational structure behind Gamma Exposure bars — where dealers are forced to act, where price gets stuck, and where it accelerates through empty space. It’s all about Walls, Magnets and Probabilities.
Proprietary Engine
Quantum Engine
The field layer. Every strike becomes a quantum node with mass, charge, and gravitational influence. Walls repel. Magnets attract. Fast Lanes accelerate. The invisible physics that explains why price reacts where it does — not just where.
Foundation
GEX Classic
The raw engine. Call/put ratio, convexity, hold/break probabilities. Every key level scored from mass, distance, and regime context. Zero Gamma, Vol Bands, PDH/PDL cross-referenced to surface the levels that truly matter.
And everything around it
Context, not calls. Structure, not signals.
- ▸ Key Levels in Action — Walls, magnets and the zero-gamma pivot drawn on the chart, with what each one is for.
- ▸ Market Pulse — Gamma, delta and volatility regime read together, in words, with the numbers behind them.
- ▸ Dealer Flow — What changed since yesterday and since last week, call side and put side kept separate.
- ▸ Session-Based Updates — Six a day — Asia, Europe, Pre-Open, RTH Open, Opening Range, Charm Kick. The map is rebuilt as the chain moves.
- ▸ Field Radar — The whole gravitational picture, with the day's price path drawn through it.
- ▸ Session Replay — Any past session played back as it unfolded, map and price together.
- ▸ Wizzie, the TLADe Guide — A structure analysis walked through step by step on your own chart.
- ▸ Release 3.5 — Vol bands measured on the chain, Expected Move Globex, Delta Flip, Max Pain, and hold / break on every wall.
- ▸ Chart Indicators — FVG, H1 AVWAP displacement, previous-day volume profile, session levels, breakout levels, session AVWAP, session boxes.
- ▸ Bring Your Own Data — TradingView, NinjaTrader 8, Sierra, ATAS, MotiveWave, Interactive Brokers, Rithmic.
- ▸ Risk Calculator — Position sizing and a Monte Carlo projection of the equity curve your rules actually produce.
- ▸ Mood-Adaptive Skins — The interface changes with the regime, so the screen tells you something before you read it.
OMG is a project by a team of quant traders and developers, united by a single belief: the most powerful tools in the market shouldn't be reserved for a select few.
We built OMG because we needed it for our own trading — an unfiltered, institutional-grade view of the market's structure, without the clutter and the expensive paywalls. The public version you see here is a lite snapshot of our full analysis suite, designed to provide a clear and immediate market overview.
The current release of OhMyGamma will remain open and free for those who wish to continue using it as an informational platform.
Looking for the full experience? TLADe is our complete institutional-grade terminal with real-time analysis, AI playbooks, and advanced features.
Efficiency is the edge.
Feel free to contact us for any information, suggestion, or request.